背景:
我们的微服务数量不会很大,也没有专门的运维给我们部署Prometheus expoter,阿里云metrics采集的收费标准是按照节点个数收费的,成本较高.
基于此,我们可以直接把expoter集成到jvm内部. 优点是方便, 缺点是 jvm挂掉后,就采集不到机器指标和业务指标了.
落地步骤:
step1:引入依赖
| <dependency> <groupId>org.springframework.boot</groupId> <artifactId>spring-boot-starter-web</artifactId> </dependency><dependency> <groupId>io.micrometer</groupId> <artifactId>micrometer-registry-prometheus</artifactId> </dependency> <dependency> <groupId>org.springframework.boot</groupId> <artifactId>spring-boot-starter-actuator</artifactId> </dependency> |
step2:配置计量注册表(MeterRegistry)
计量注册表用于负责创建和维护指标,类似于上下文的改变
| @Bean MeterRegistryCustomizer<MeterRegistry> configurer(@Value(“${spring.application.name}”) String applicationName){ return registry -> registry.config().commonTags(“application”, applicationName); } |
step3:暴露Prometheus接口
actuator的接口默认是不暴露的,出于安全考虑. 但有些攻略上图省事,直接把所有接口全暴露出去了… 这里我们按需暴露
| management: endpoints: web: exposure: include: info,health,prometheus metrics: tags: application: ${spring.application.name} |
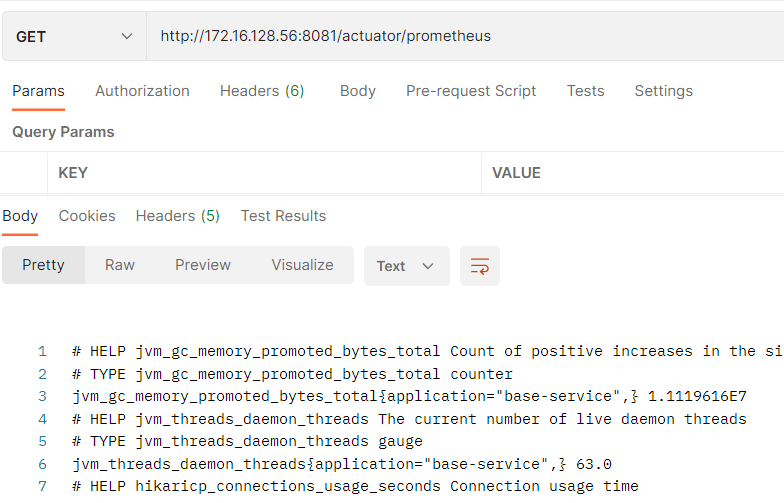
至此,可以用过下面的接口,以Prometheus的数据格式,拉去系统内置指标了.
http://172.16.128.56:8081/actuator/prometheus
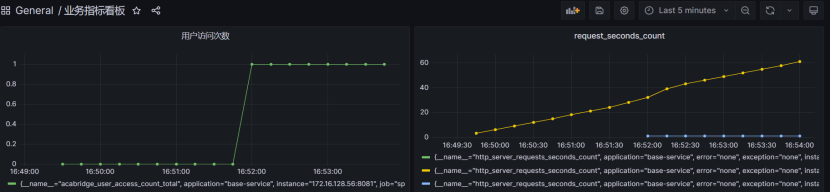
step4:业务指标埋点
直接看代码
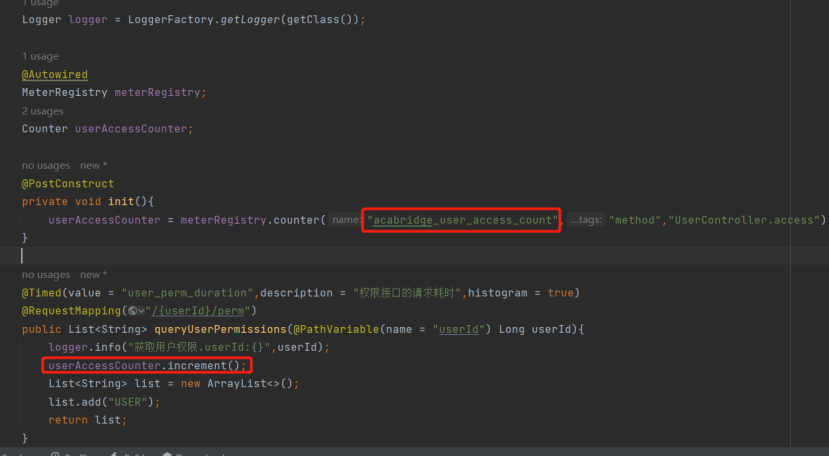
接口被访问后,此count计数+1;
其他更多的指标统计方式,按照业务需要埋点就好,不做详述;
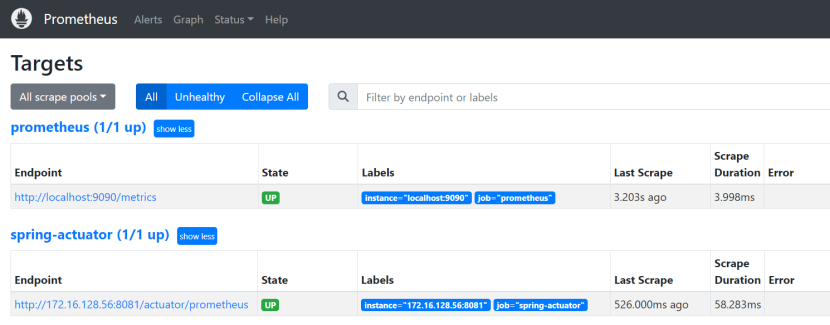
step5:配置和启动Prometheus
本地是使用docker启动的,配置文件里需要配置job-name,targets等
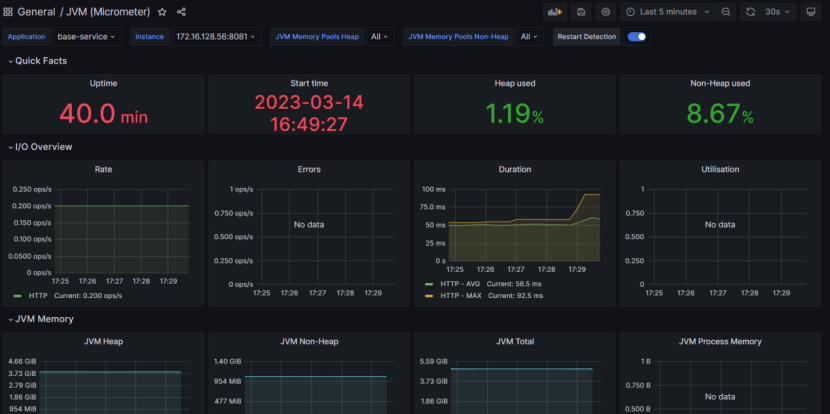
step6:配置和启动grafana
因为普罗米修斯的界面基本不可读,所以需要grafana进行指标展示.
首先配置数据源,然后导入模板,就可以快速创建一个面板;
对于业务指标,就新建模板,配置上我们关注的指标就好;
更多类型的指标,指标计算方式,随着业务需要进行配置或编写公式即可. 这块需要多配一些dashboard才能有体会.